Top 14 Google Analytics Metrics to Feel the Pulse of Your Website Success
8 min to read

Measure → Analyze → Improve
Google is getting more and more critical to your website optimization work, as all of us have noticed. Yeah, I’m talking about all these Google-noodle updates bringing your websites up and down in the rankings. Does this remind you of anything?
Google is, at least, very attentive to its users and now provides everyone with powerful free tools and apps that make optimization work easier and more effective. The most powerful app that Google ever created is still Google Analytics. There are a lot of reports in this app that should be reckoned with.
If you are obsessed with finding answers to the following questions then Google Analytics is the source you need.
Google Analytics reports are split on several blocks of metrics: Audience, Traffic (Acquisition), Content (Behavior), Social.
If you want to rank high and get high visibility for your content on any type of device and in any area, then make your website competitive in mobile search results and conduct local SEO to make your site appear in local results and on local listing sites.
The most essential reports in this block are:
1. Geo metrics
– Language
– Location
These metrics are useful since they give a vision of what language your users speak and their location. This kind of information helps you decide whether you should conduct multi-language website optimization (creating subfolders of the site to target multi-lingual people). When you are aware of the location of your visitors, you can then also work on creating local versions of a website and make use of local search optimization to get more traffic and increase your rankings.
2. Behavior metrics
– New vs Returning
– Engagement
These types of reports show you the correlation of new visitors to those who have already visited your site before. Make an analysis of the bounce rate.
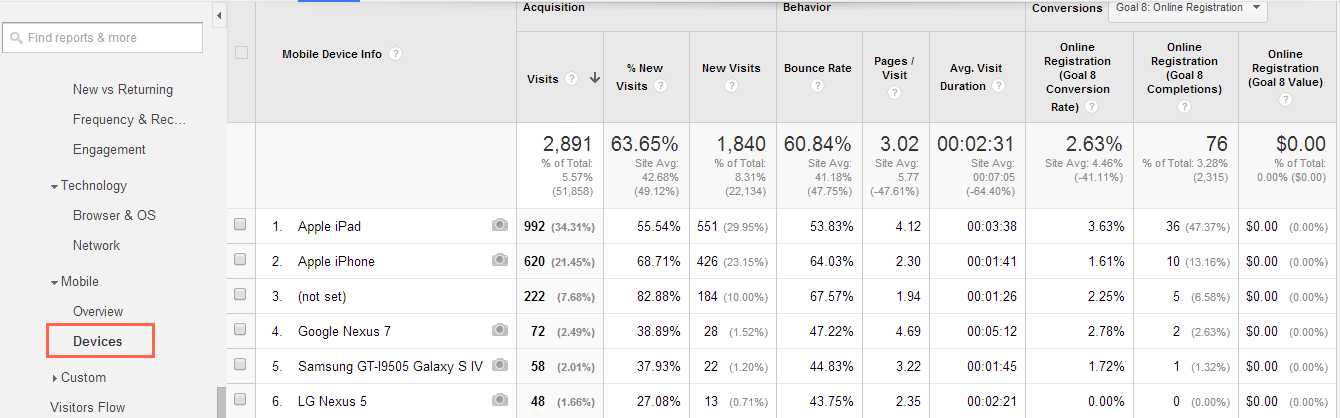
3. Mobile metrics
– Overview (what type of device is used)
– Detailed device information
This kind of report is a must-to-track. In the era of mobilization it’s important to analyze how well your website is displayed on different types of devices, including tablets and smart phones. Is your website mobile-compatible and well optimized for mobile? If your website is not yet responsive, you had better make this happen quickly.
(click on the image to see a full version)
4. Channels/All traffic metrics
This report shows a site’s overall traffic sources. Here you can see organic search traffic from different search engines, paid search, direct search and website referrals.
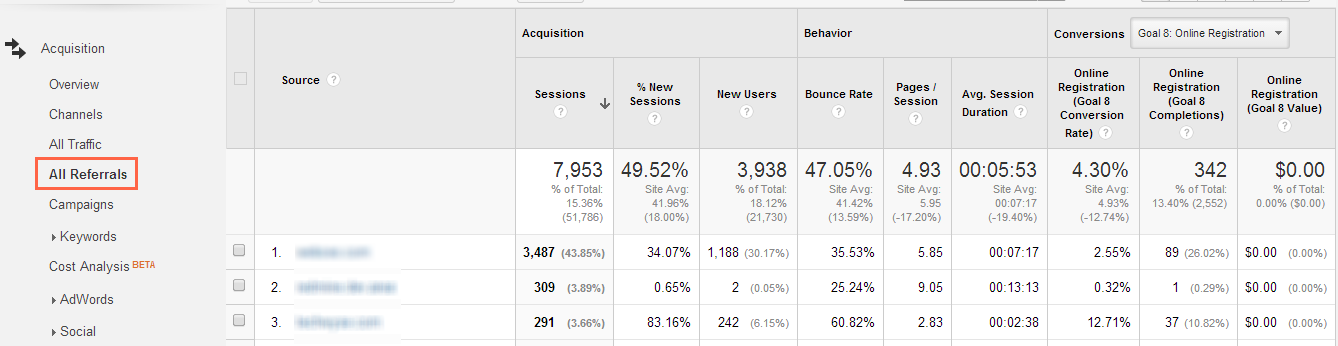
5. Referrals metrics
This report evaluates the websites that send visitors to your site from their website. Clicking on each of the website URLs, you will be directed to the links of the pages your website is linked from. Take a look at the sessions, bounce rate, pages/session and average session duration. Are there backlinks that have a high bounce rate, a low number of pages/session and low average session duration? Do you want to get a closer look at these backlinks and find out what is the issue with them? Web CEO will help you to claim a deeper insight of your backlink profile, including analysis of a linking domain and linking page analysis, as well as a detailed overview of anchor texts. As a result, Web CEO will help you to detect low quality links within the Toxic Links report.
(click on the image to see a full version)
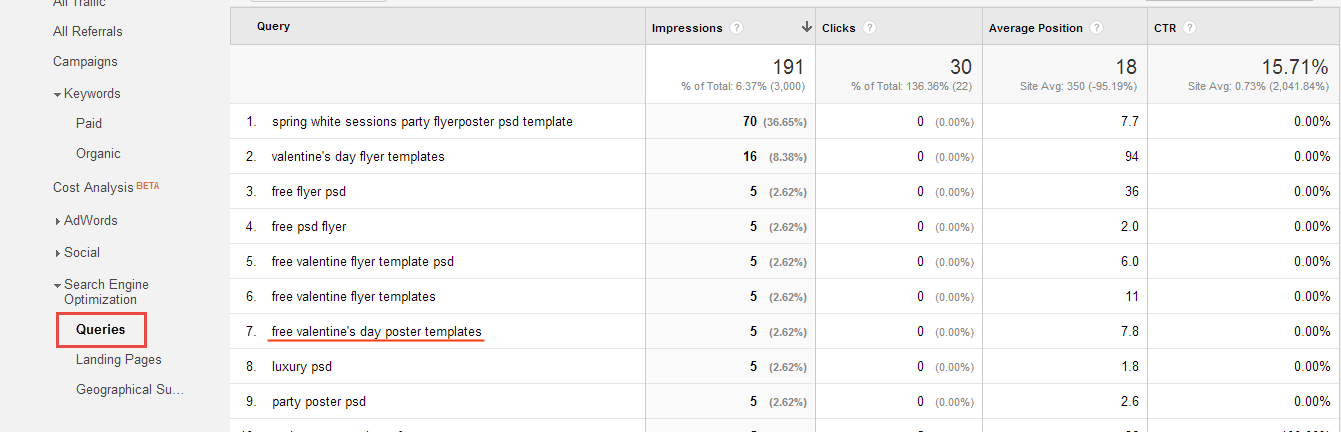
6. Keywords metrics
– Organic
– Paid
Here you can see the keywords that were used by users to find your website, whether these are organic or paid search keywords. This type of data is not fully accurate because Google now has a “not provided” policy for those who search while being signed in to Google. Analyze the effectiveness of your tracked keywords and complement your analysis with a Queries report provided within the Search Engine Optimization section of Google Analytics. This type of keyword analysis shows the popularity of this or that search term or long-tail phrase used by users to reach your site.
(click on the image to see a full version)
Find out what of your pages perform best of all in the Landing Pages report.
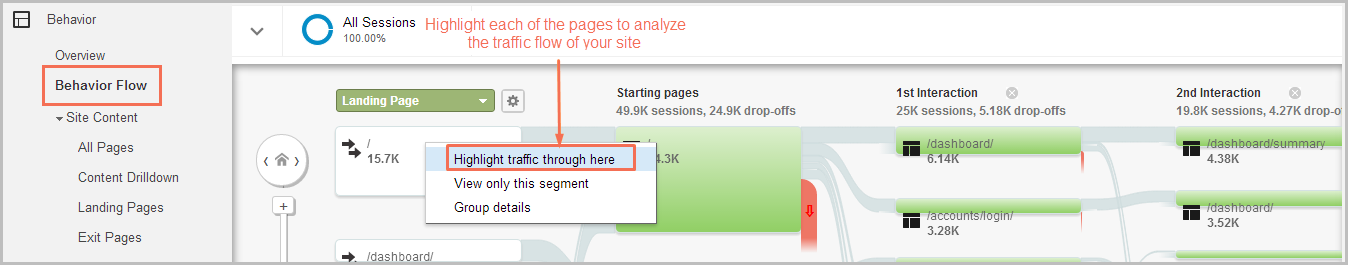
7. Behavior flow metrics
This report is shown in the form of traffic map interaction by visitors.
(click on the image to see a full version)
8. Site Content metrics
Here you can find a lot of useful data metrics that will help you to measure the success of your content. Take a deeper view of:
– All pages report
– Landing pages
This report shows your website’s landing pages’ performance metrics (i.e.: total number of sessions and new sessions, bounce rate, average pages depth/session, conversion data per goal etc.)
– Exit pages
This is a valuable piece of data showing the number of exits taken by users from particular pages of your website. A high number of exits may indicate poor on-site optimization. Check if you have some on-page issues and make a deep SEO audit of those pages that have a high exit rate with the help of the Web CEO Content Optimization tool.
9. Site Search metrics
This block of reports is a must-track set of metrics that every Ecommerce website should take into account. Do you have an idea of how well your website internal search converts into sales? Those website owners who have an internal search option (search box) on their site can draw a lot of useful information that would help you to customize your website experience, product pages information and improve your inbound marketing efforts.
Here you can measure the success of the social media activity that includes mentions of your website (content) and monitor the interaction of users with your content both on site and off site.
Here you can find quite a solid block of reports.
10. Social Overview metrics
Take an overall view of all the networks your content is shared on and all the pages that were shared on social platforms.
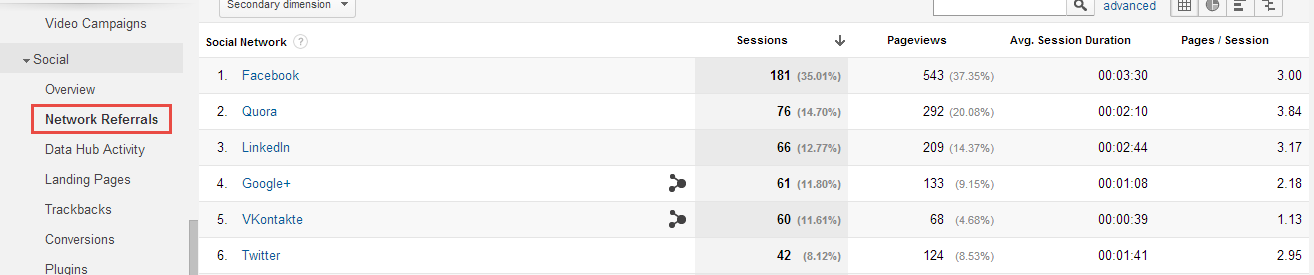
11. Network referrals
(click on the image to see a full version)
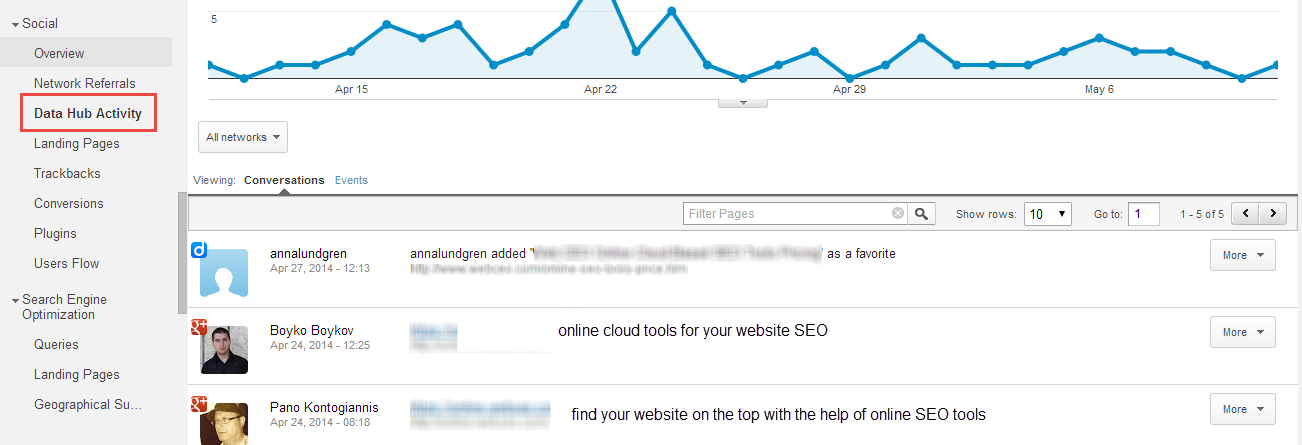
12. Data Hub Activity
This is a social mentions report that reveals the conversations your brand (website URL) has had via mentions. Here you will see only those social media platforms that are integrated with Google Analytics (Social Hub Activity partners).
(click on the image to see a full version)
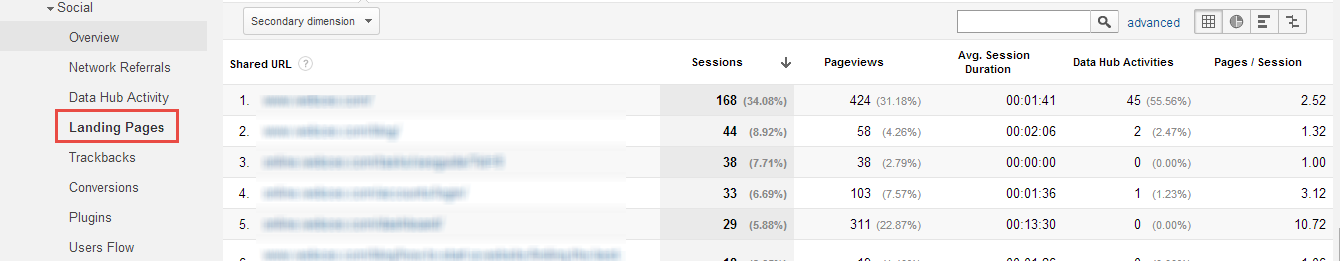
13. Landing Pages
Click on each of your landing pages to see what social channels it was shared on.
(click on the image to see a full version)
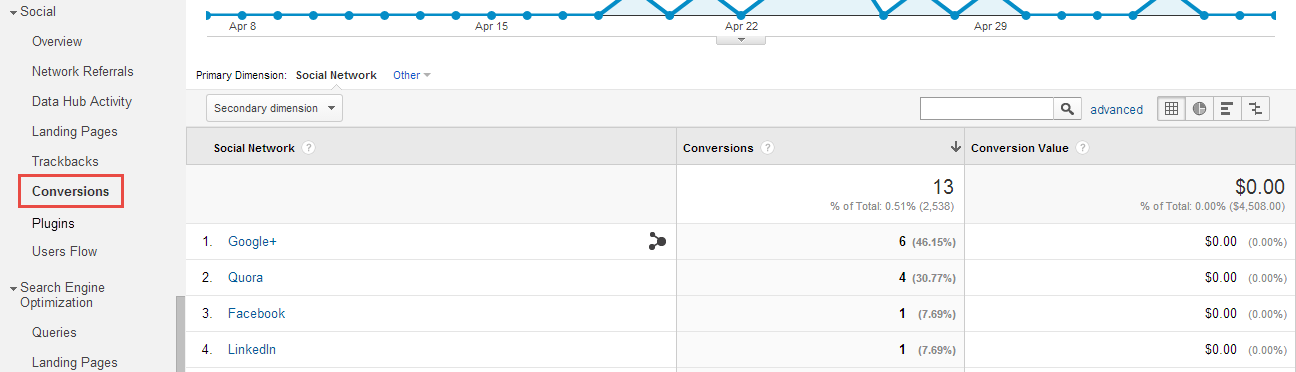
14. Conversions
Here you can see the number of conversions that were completed via this or that social platform
(click on the image to see a full version)
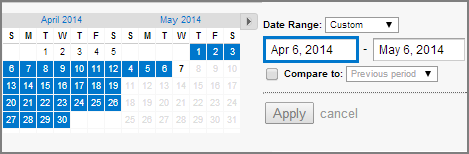
One of the most powerful features you should use to track positive and negative fluctuations is the date range filter that is easy to set in any of the Google Analytics reports. You can compare today’s data to a previous date of performance tracking
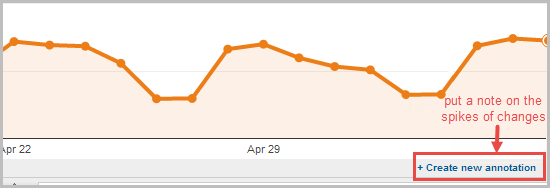
You can also make annotations where some drastic changes took place (e.g. some promotional, PPC or Social media campaign etc.)
The most important dimensions within each of the reports are:
Sessions/New sessions/New users
These data rows show the overall number of visits to your site and the unique visitor flow for a particular period of time.
Bounce rate
This data row can upset you, but on the other hand, a high bounce rate can make you stronger and your site better, if you interpret it in the right way. Look at your bounce rate together with your traffic trend changes. The ideal picture is when your website traffic increases while the bounce rate decreases. But when the bounce rate increases together with traffic, it’s a kind of an alert: the new people coming to your site aren’t finding what they intended to find (and maybe your new visitors were not targeted properly). To lower the bounce rate, make sure your Meta description matches the content on the site. Pay attention to your landing page optimization (page navigation, anchor text usage, fit-for-purpose CTAs), as these are the entry pages of your website.
Pages/Session and Avr.Session Duration
This data row shows how deep and how long users have interacted with your site during one session. Theses insights are useful to get an idea of your website navigation and internal links structure. If users visit as a rule only one page or two pages, then maybe your website has a poor navigation structure.
Conversions
This row provides the conversion rate and the direct number of conversions per campaigns you have set (registration, sales etc.)
Another powerful feature of GA is Reports Customization
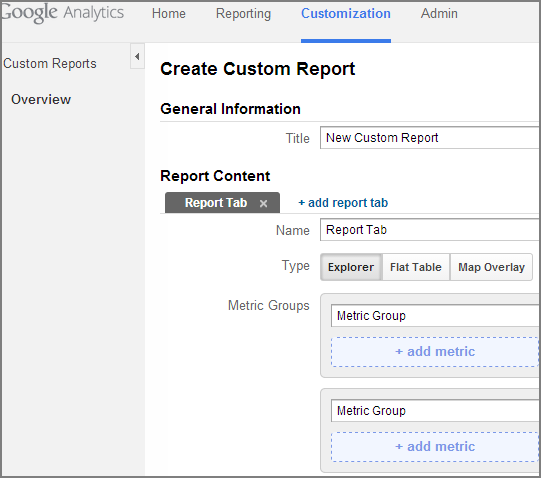
Use custom reports to measure and analyze only those metrics that are valuable for your website performance tracking. This feature is useful for huge Ecommerce websites or non-commercial websites that pursue some specific goals.
We suggest you take a deep and comprehensive analytical approach to your website optimization success. Make use of the Web CEO Online SEO tools to monitor your rankings constantly and do a once-per-quarter in-depth backlink analysis with toxic links detection.